
Seller Reports
Reports show how your shop is doing over any period, with each figure compared with the period before. There are three reports: Sales, Customers and Products.
Go to Reporting in the Seller Panel and choose a report.
Choose the period
Use the date picker at the top right. Pick a preset, such as Today, Last 7 Days, Last 30 Days, This Month or Last Year, or choose your own dates. Reports open on the last 30 days. If you sell on more than one channel, choose the channel too.
Cards with a total, such as Total Sales, show the figure for the period, how much it changed from the period before, in green or red, and a chart. Cards that list products or customers show the top five as bars.
Sales
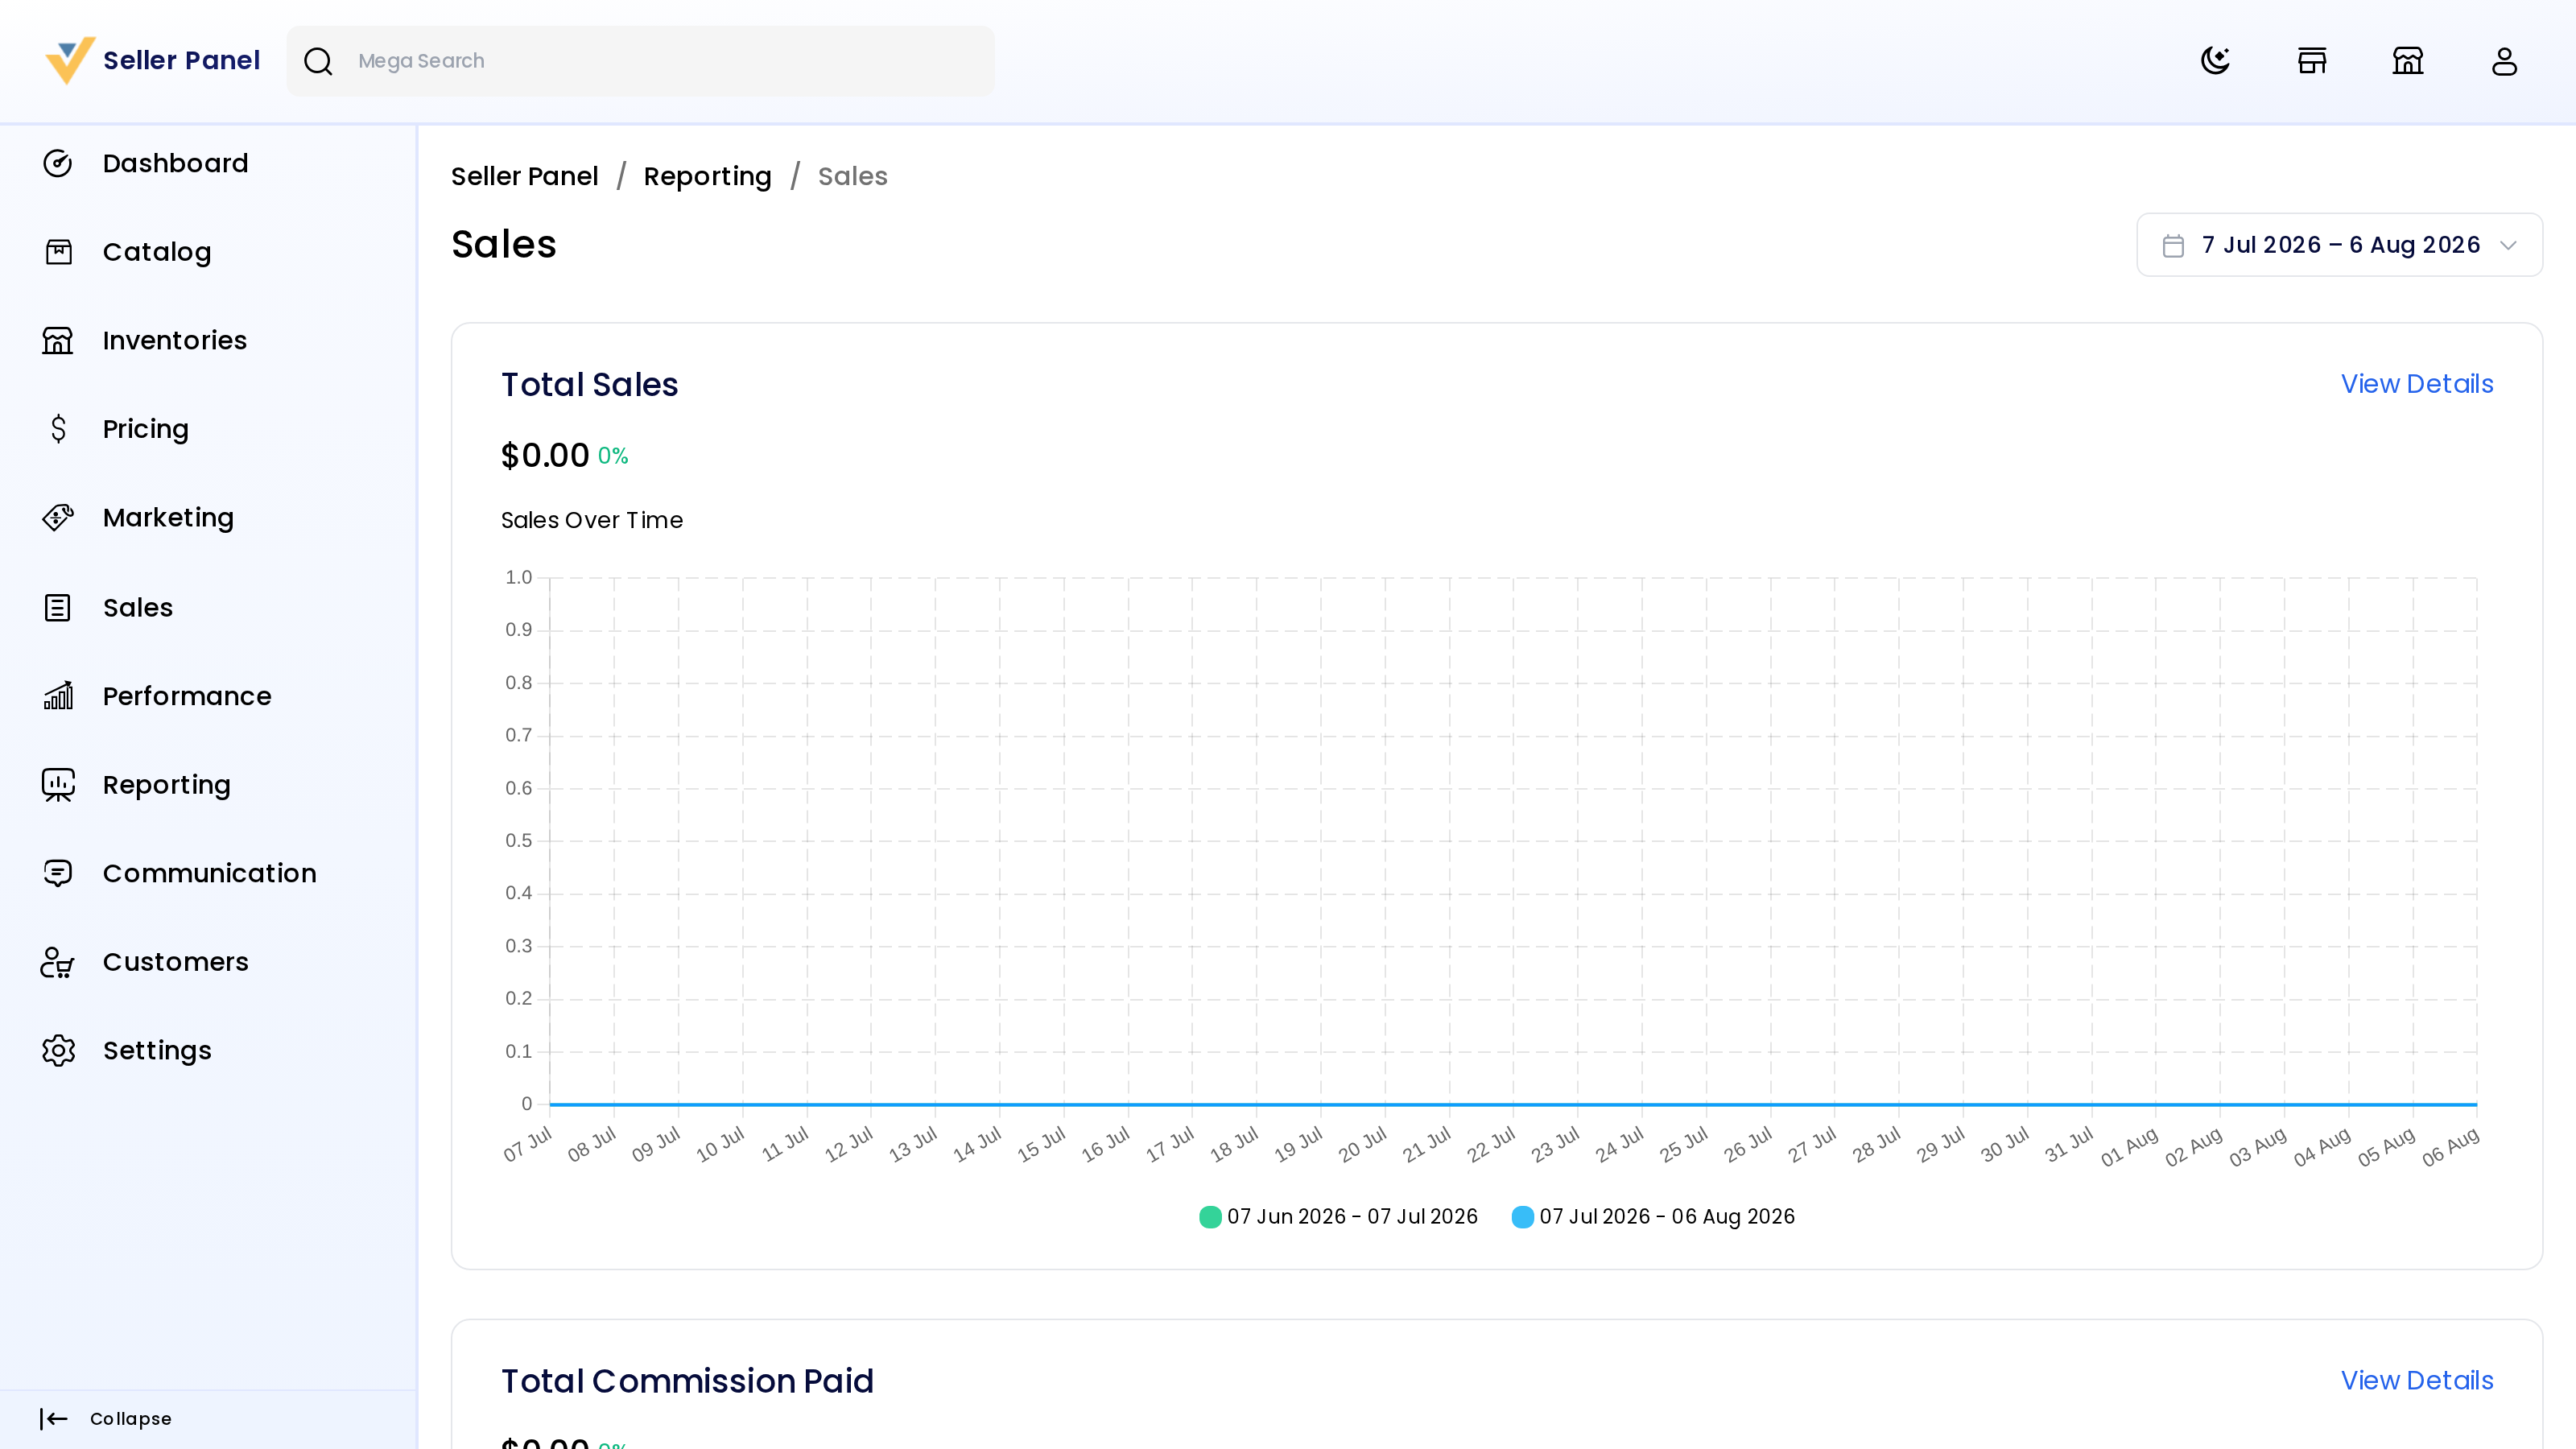
| Card | What it shows |
|---|---|
| Total Sales | Your sales over time |
| Total Commission Paid | The commission taken from your invoiced sales |
| Purchase Funnel | Products added to the cart, and purchases. Visitors and product views aren't counted, so they show 0. |
| Abandoned Carts | Carts left without ordering, their value, and the products left behind |
| Total Orders | Orders over time |
| Average Order Value | The average value of an order over time |
| Tax Collected | Tax over time, and the top tax categories |
| Refunds | Refunds over time |
| Top Payment Methods | The payment methods customers used most |
Customers
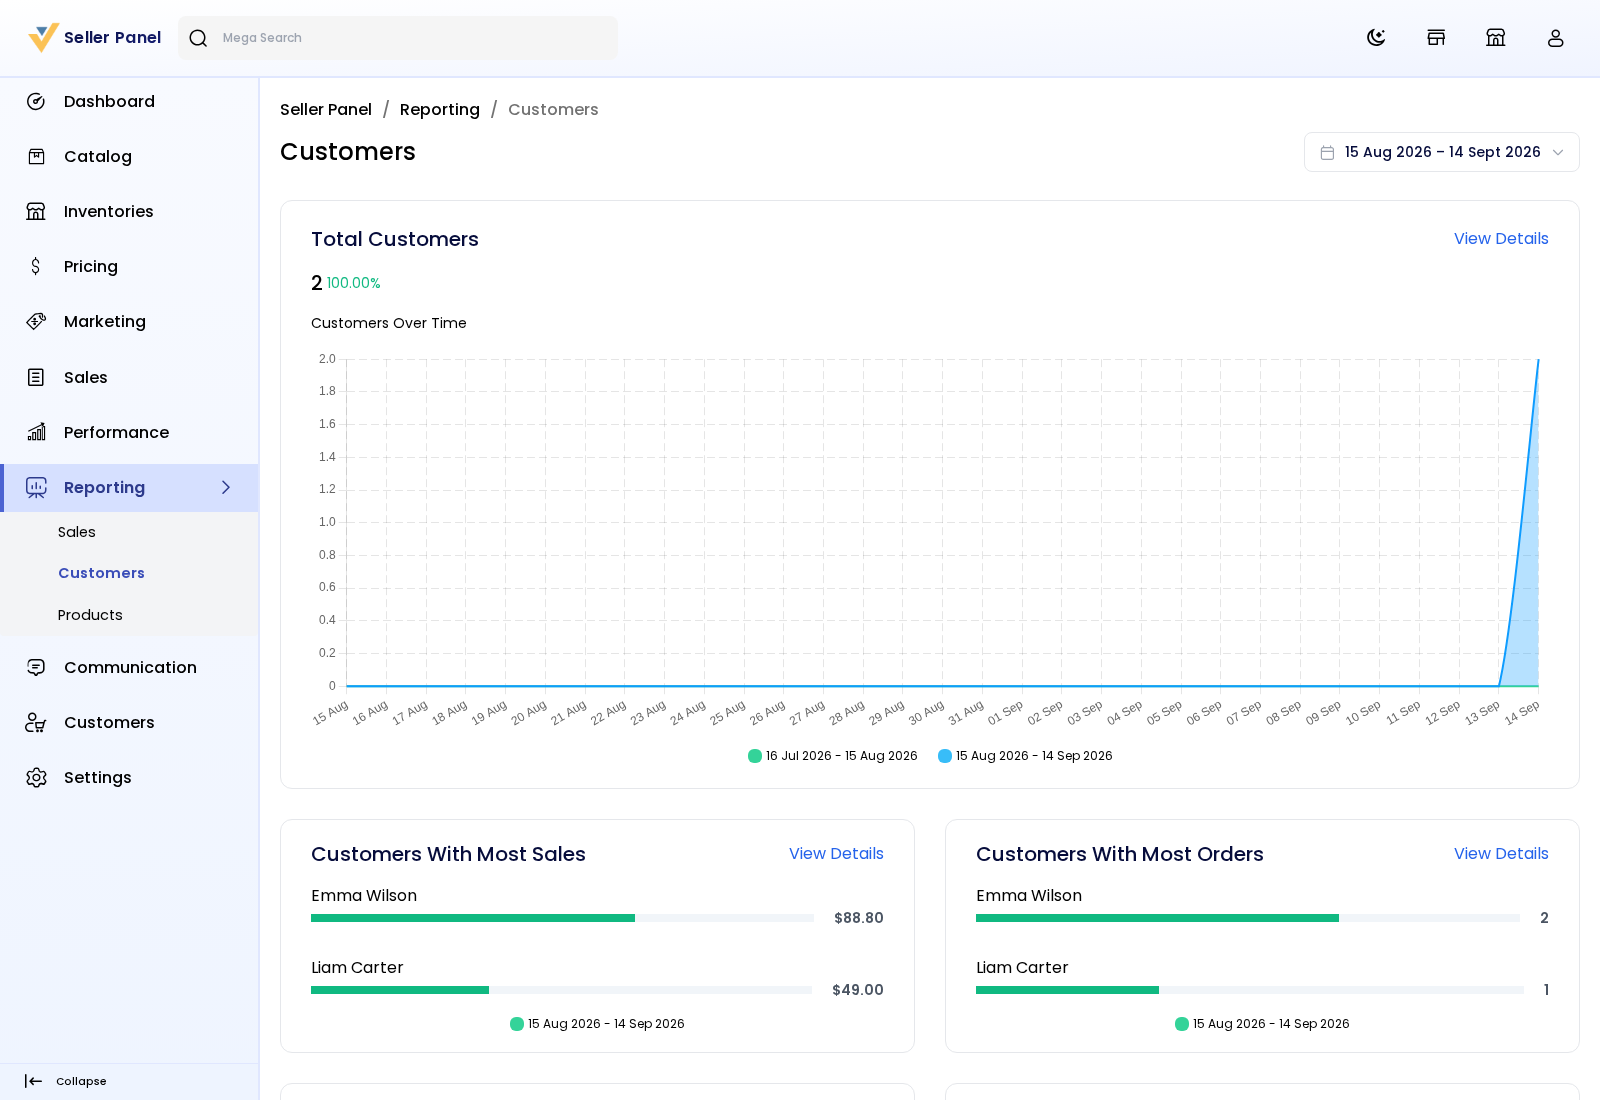
- Total Customers — customers over time.
- Customers With Most Sales, Customers With Most Orders and Customers With Most Reviews — your best customers.
- Top Customer Groups — the customer groups that buy from you most.
Customer email addresses are masked when the store doesn't let sellers see customer details.
Products
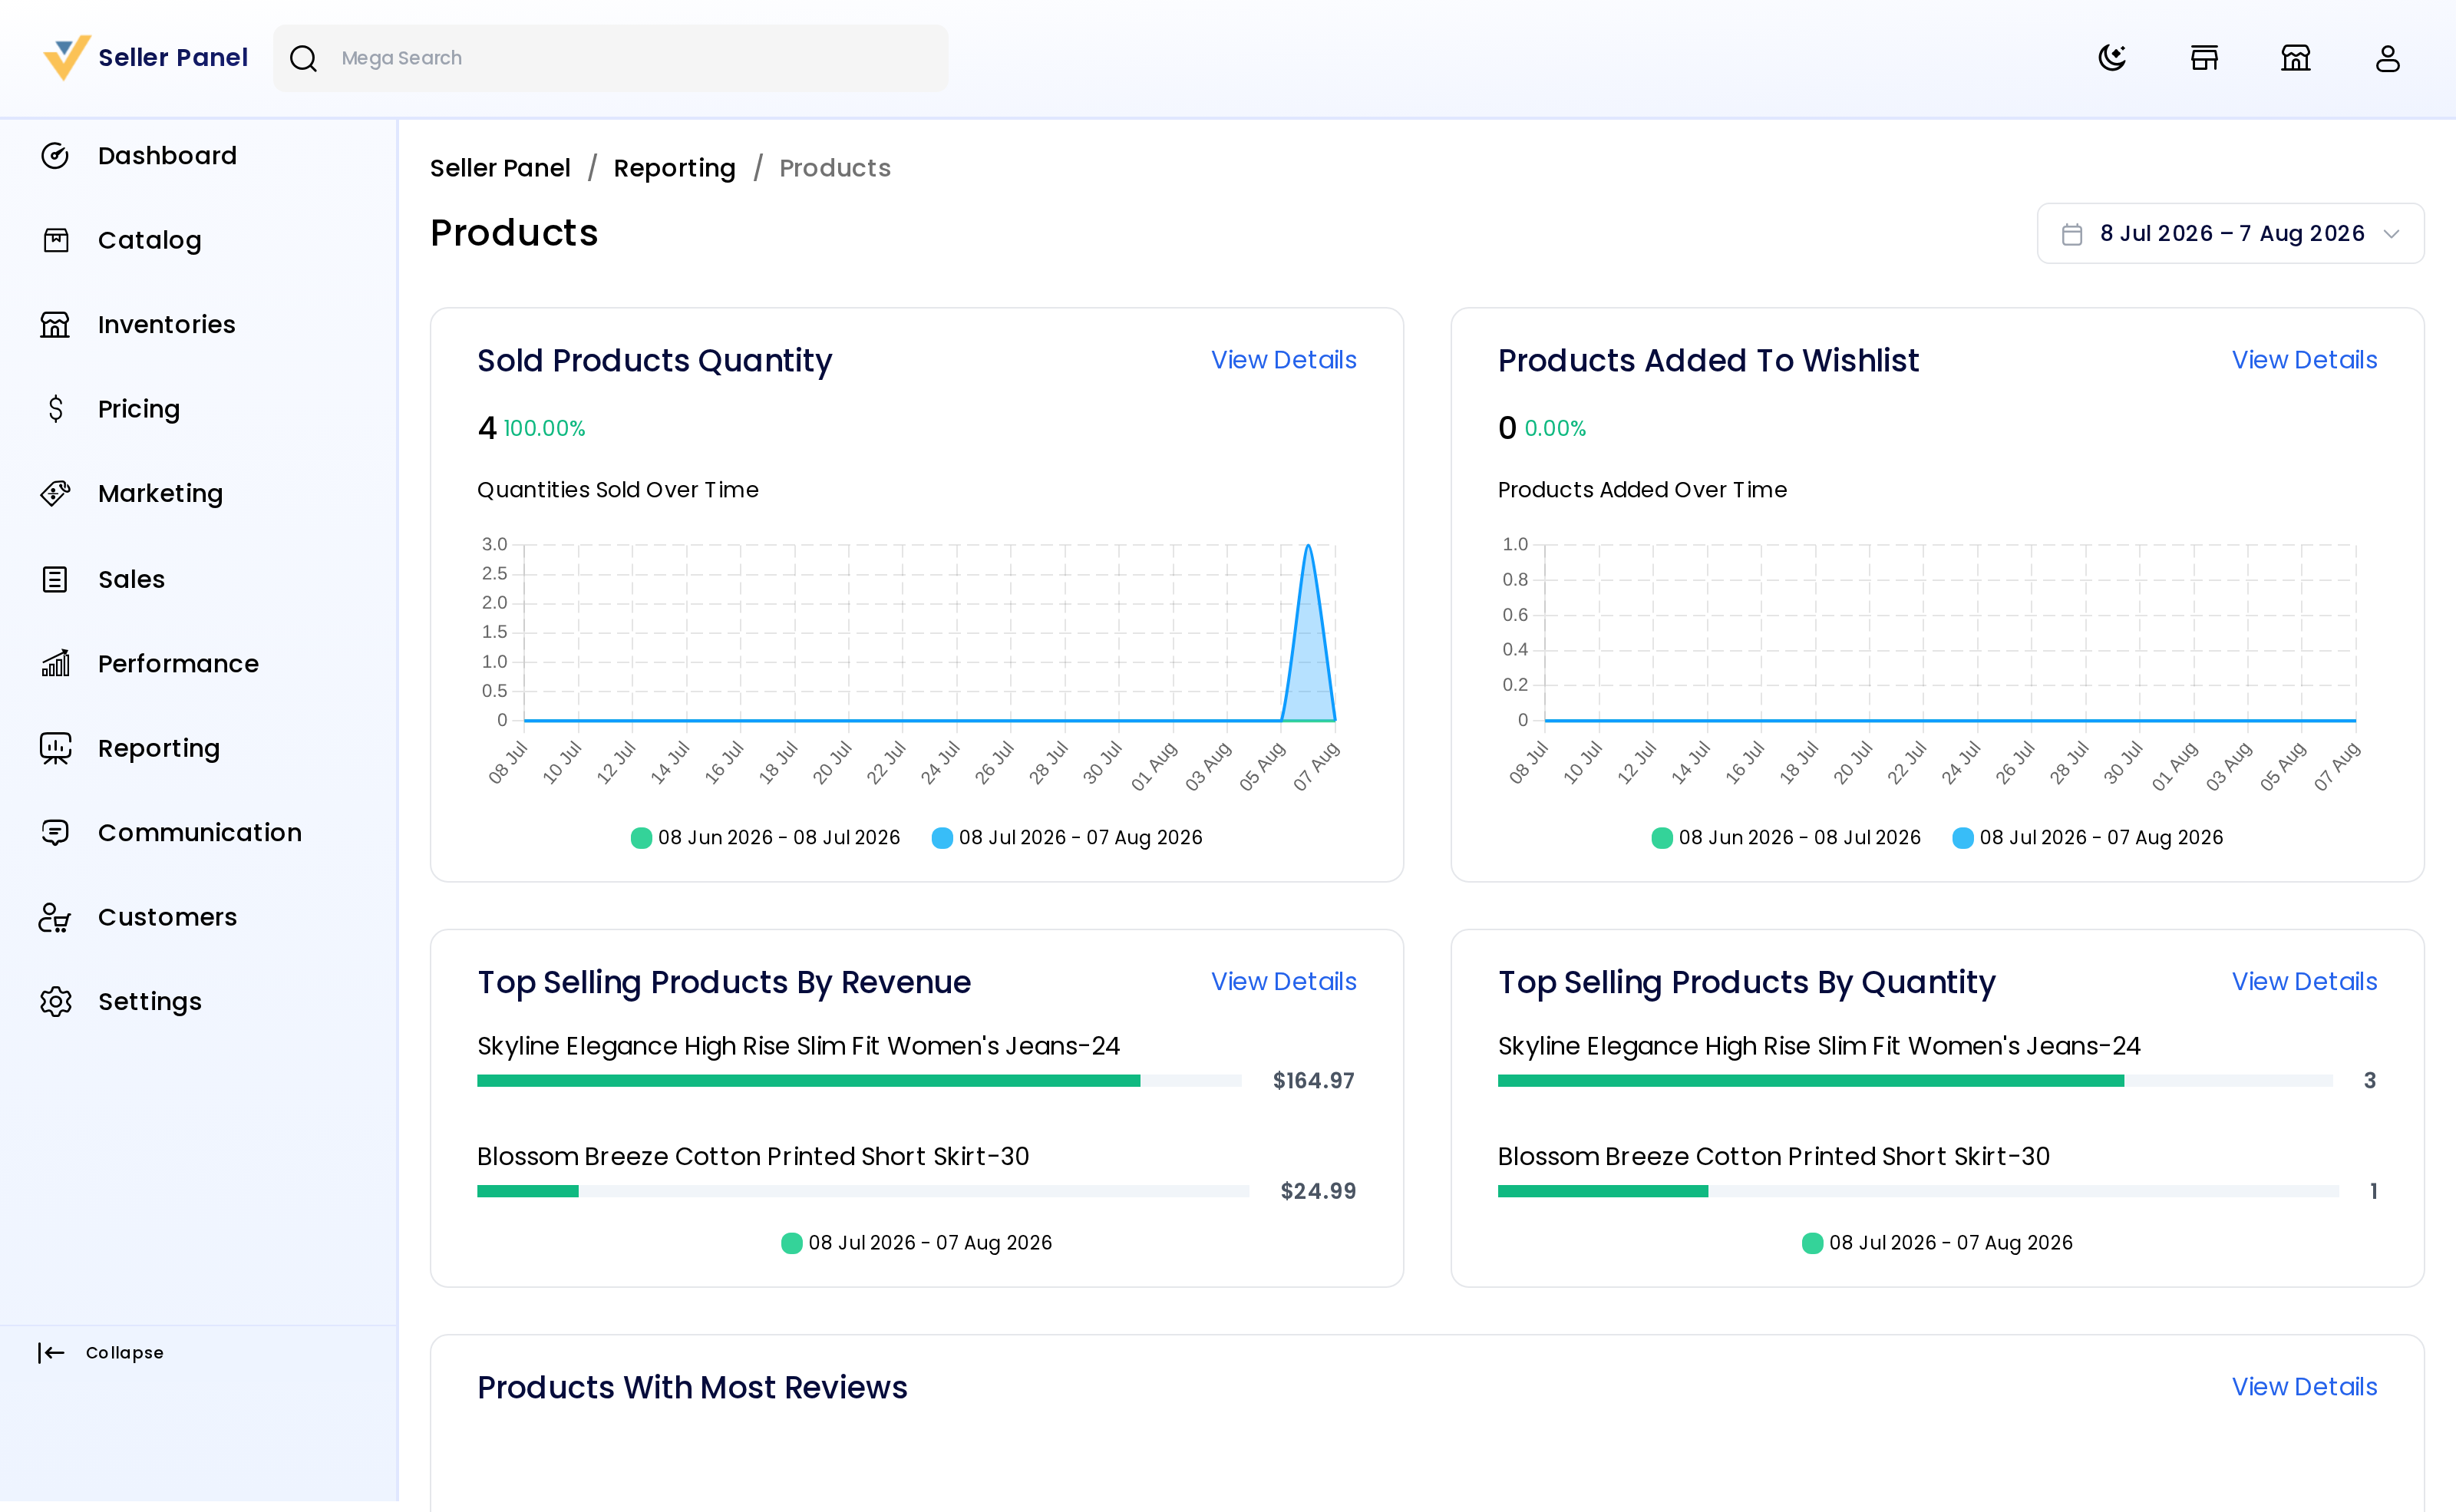
- Sold Products Quantity — how many products you sold over time.
- Products Added To Wishlist — how many of your products were added to wishlists.
- Top Selling Products By Revenue and Top Selling Products By Quantity.
- Products With Most Reviews.
See the details and export
- Click View Details on a card.
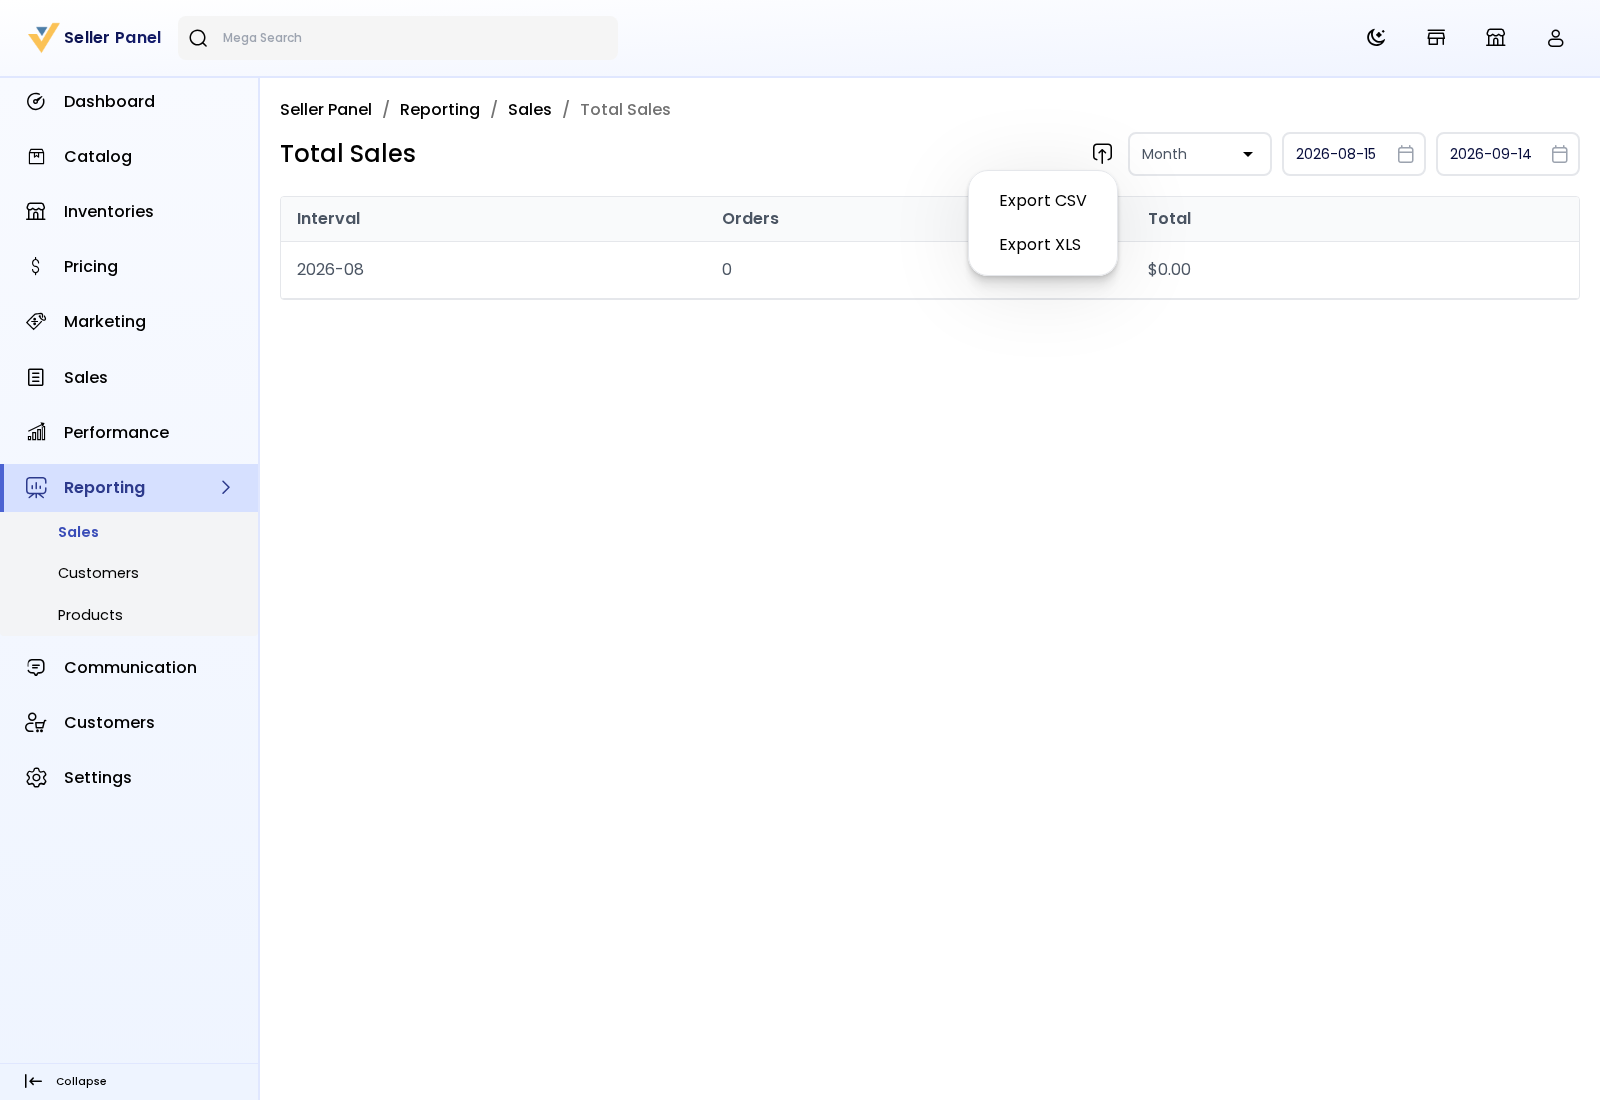
- Choose the start and end dates, and the channel. For most charts, also choose whether to group by Day, Month or Year. Total Commission Paid is always shown by day.
- To download the table, click the export icon and choose Export CSV or Export XLS.
Purchase Funnel has no details page, so it can't be exported.
Team members need Reporting, with Sales, Customers and Products as needed.